Content Dashboard Interface
Available 7.3+
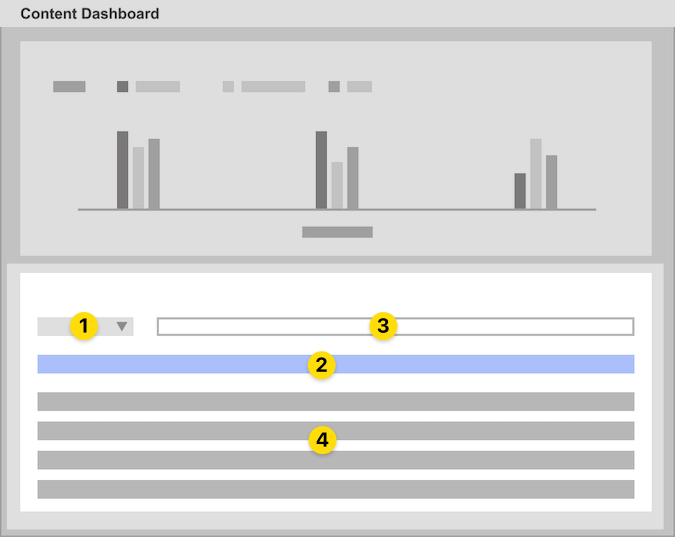
The Content Dashboard user interface has three main sections:
To access the dashboard, open the Global Menu (![]() ), go to the Applications tab, and click Content Dashboard.
), go to the Applications tab, and click Content Dashboard.
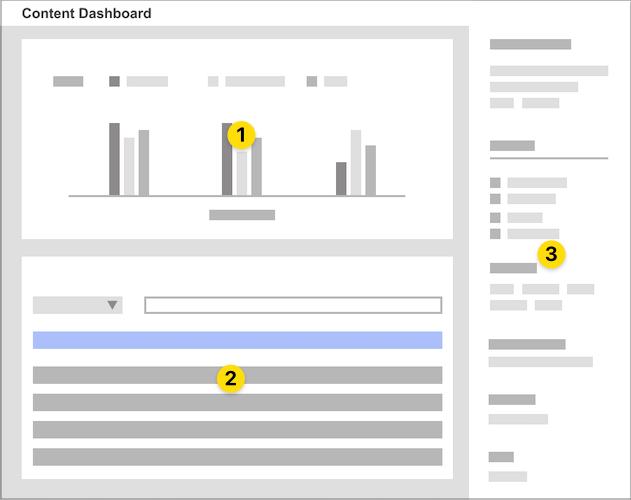
Here you can view the content audit tool (1) at the top of the page and the contents list (2) at the bottom.
From the contents list, you can access the content info sidebar (3) by hovering over a content item and clicking the Info button (![]() ). Alternatively, you can click the content item’s Actions button (
). Alternatively, you can click the content item’s Actions button (![]() ) and select Info.
) and select Info.
If the instance is connected to Analytics Cloud, you can also select View Metrics to open the Content Performance side panel. See About the Content Performance Tool for more information.
Content Audit Tool
The content audit tool displays assets from the contents list section in a chart. This chart represents the total number of assets for the selected vocabularies and categories and can include items from all sites and asset libraries. However, the chart only displays data the current user can access. You can also restrict chart results using contents list filters.
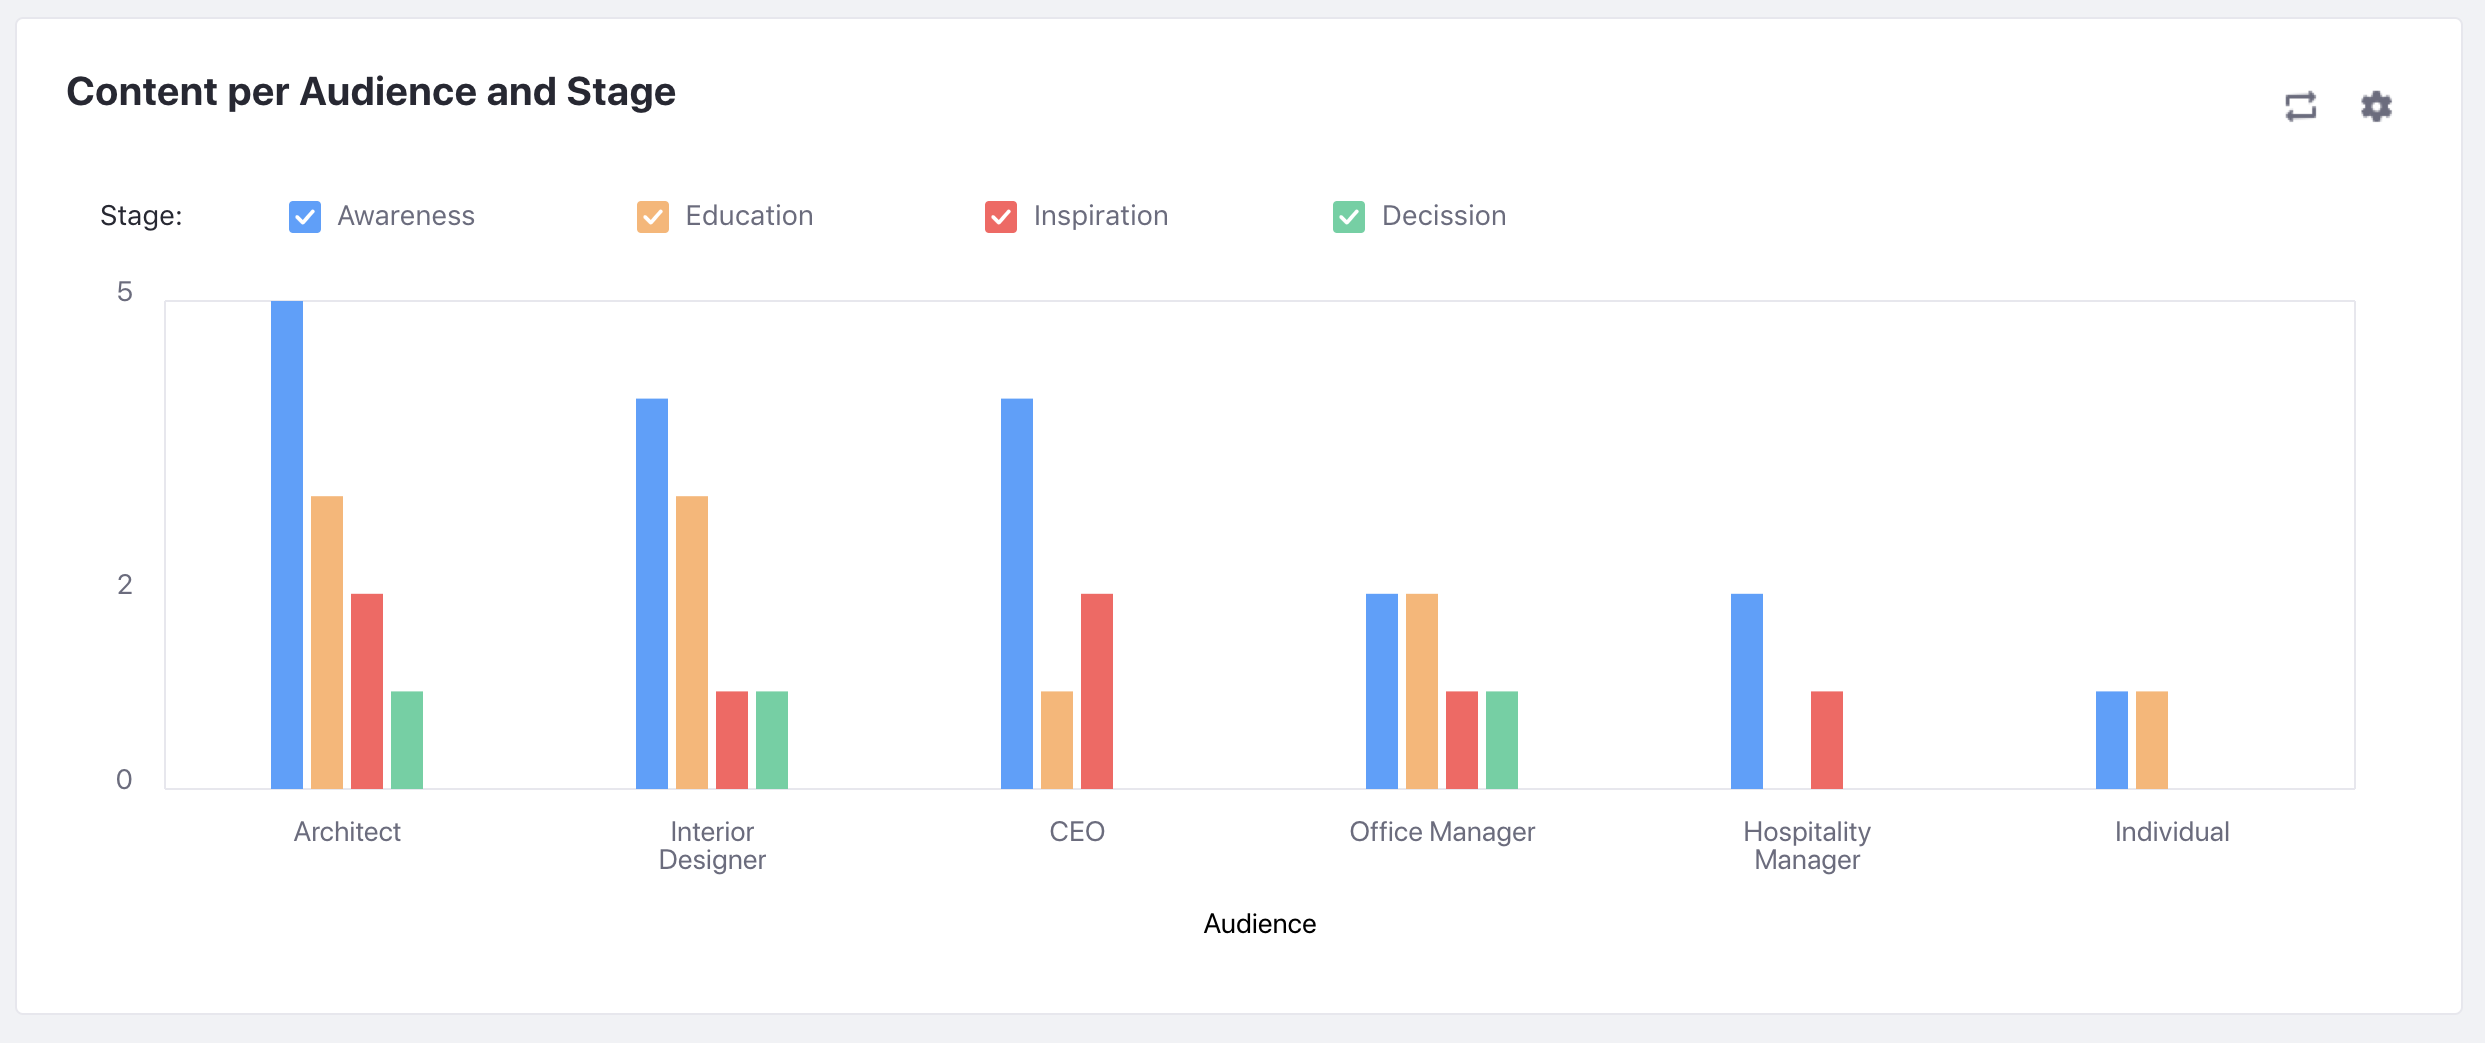
If the chart does not display the expected information, verify your categories for the selected vocabularies and ensure that your content is categorized.
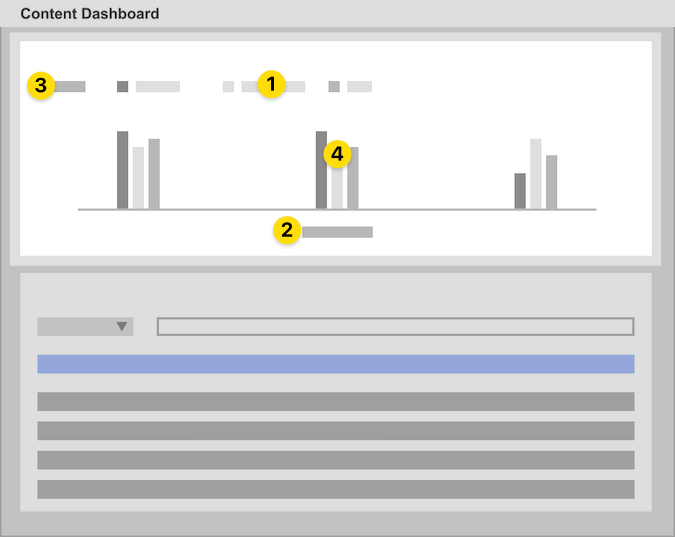
The content audit tool includes four UI elements: the chart legend, the x-axis categories for the first vocabulary, the y-axis categories for the second vocabulary, and the bar chart.
Customizing Vocabularies and Categories for the Content Audit Tool
By default, the bar chart shows the total number of assets for each category in the selected vocabularies. To change these vocabularies,
-
Click Configure (
 ) in the content audit area.
 -
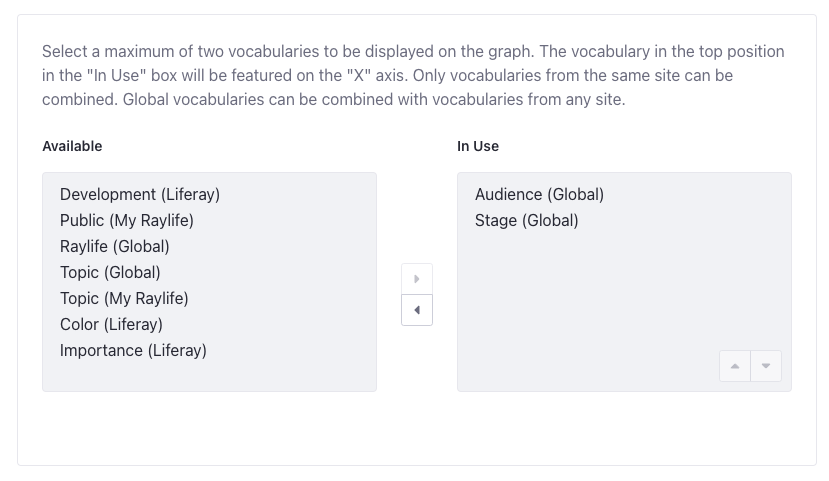
Use the left and right arrows to select which vocabularies to display in the chart.
You can only use one or two vocabularies at a time. Also, you can only combine vocabularies from the same site. However, you can use global vocabularies with vocabularies from any site.
-
Click up and down to order the vocabularies.
The chart uses the top vocabulary for the x-axis and the bottom vocabulary for the y-axis.
-
Click Save.
Click Flip Axes (![]() ) to quickly switch the x- and y-axes.
) to quickly switch the x- and y-axes.
Contents List
By default, the contents list displays all content you can access across your sites and asset libraries. From here, you can sort and filter this content using built-in or custom filters. The content audit tool chart changes dynamically based on the filters that you set.
The contents list includes four UI elements: a filter and sort selector, a filter editor, a search field, and a list of contents.
In the list of contents are the following columns:
| Column | Description |
|---|---|
| Title | The content’s title. |
| Author | The content’s author. |
| Type | The content type: web content article, 7.4 U23+/GA23+ blogs entry |
| Subtype | The content subtype. |
| Site or Asset Library | The content item’s location in the Liferay instance. |
| Status | The workflow statuses for each content item. |
| Vocabulary (x-axis) | The categories applied to the content item from the content audit tool’s x-axis vocabulary. |
| Vocabulary (y-axis) | The categories applied to the content item from the content audit tool’s y-axis vocabulary. |
| Modified Date | The content’s last modified date |
| Review Date | The content’s review date |
The content list uses the Page icon (![]() ) to identify assets that have a display page template.
) to identify assets that have a display page template.
You can hover over content in the list to access these actions:
-
View (
 ): View the content’s display page.
 -
Edit (
 ): Open the content in edit mode.
 -
Info (
 ): Open the content info sidebar.
 -
View Metrics (
 ): Open the content performance panel.
Filtering and Sorting Content in the Contents List
From the Filter and Order drop-down menu, select a pre-defined filter. You can also sort content by title or modified date.
You can use the search bar to filter content by keyword or click a bar in the content audit chart to filter content by the selected category.
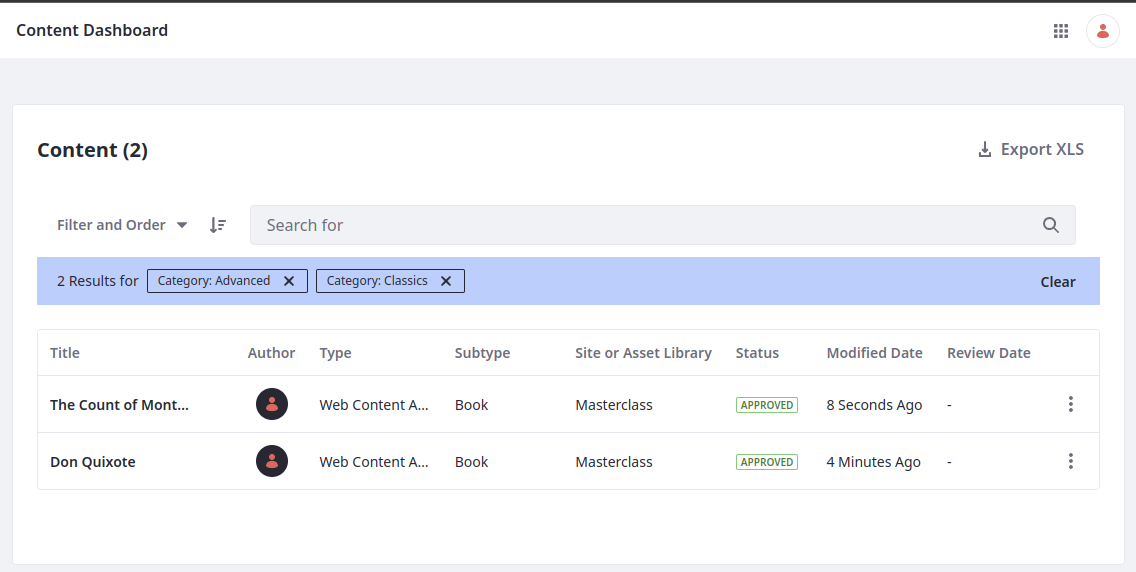
See Understanding Contents List Filters for more information on how combining filters works.
When you close the dashboard page, the default filter and sorting option are reset.
Filter Options Reference
For 7.4+
From the Filter and Order drop-down menu, you can choose these options:
| Filter | Description |
|---|---|
| Categories | Filters using one or more categories from your vocabularies. |
| Site or Asset Library | Filters by site or asset library. |
| Type | Filters by content type and subtype, including out-of-the-box and custom subtypes. |
| Tags | Filters by content tags. |
| (Liferay DXP 2024.Q3+/Portal 7.4 GA125+) Size | Filters images and videos by file size:
|
| (Liferay DXP 2024.Q4+/Portal 7.4 GA146+) Filter by Resolution | Filters images by resolution:
|
| (Liferay DXP 2024.Q4+/Portal 7.4 GA146+) Filter by Aspect Ratio | Filters images by aspect ratio:
|
| Extension | Filters by file extension:
|
| Filter by Status | Filters by the content’s workflow status. |
| Filter by Author | Filters by content author. |
| Filter by Review Date | Filters by the content’s review date. |
| (Liferay DXP 2024.Q3+/Portal 7.4 GA125+) Filter by Custom Date | Filters by Create, Display, Expiration, Modified, Published, or Review dates. Select a from/to range for your filter. |
| Order By | Filters by the content’s title, modified date, or review date. |

Understanding Contents List Filters
When you use the categories or tags filters with more than one criteria, the results correspond to content that meets all the criteria (see example A.)
When you choose multiple options for the same filter criteria, the contents list shows assets matching at least one option (see example B.)
The criteria from different filters is combined using the and operator (see example C.)
| Example | Filter By | Filter Example | Contents List Results |
|---|---|---|---|
| A | Categories | Categories: Entrepreneur and Family | Only assets that belong to both the Entrepreneur and Family Categories. |
| B | Authors | Authors: Peter and Linda | Assets authored by Peter or Linda or both. |
| C | Categories, Authors | Category is Entrepreneur and Author is Linda | Only assets under the Entrepreneur Category and authored by Linda. |
Content Info Sidebar
The info sidebar provides access to actions and metadata for your selected asset. To open the sidebar, click Actions (![]() ) for the desired asset and select Info. Alternatively, you can hover over the asset and click Info (
) for the desired asset and select Info. Alternatively, you can hover over the asset and click Info (![]() ).
).
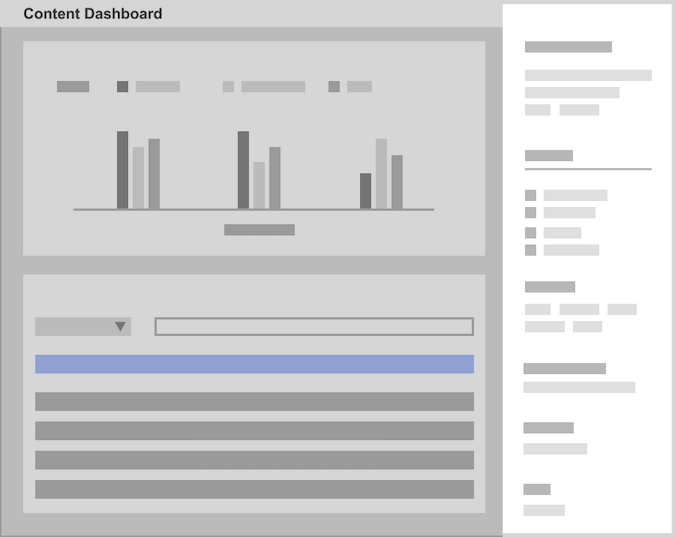
The Content Info sidebar is split into four tabs:
Asset Details
The Details tab is selected automatically when you open the Content Info sidebar. It contains a list of metadata for the selected asset. The data displayed depends on the type of asset.
Web Content
- Title
- Type 7.4 U44+/GA44+
- Subtype
- Version (current active version)
- Status
- Author
- Preview Image 7.4 U42+/GA42+
- Languages Translated Into
- Display Date
- Creation Date
- Modified Date
- ID
- Subscribe 7.4 U42+/GA42+
Blog Entries
- Title
- Type
- Version (current active version)
- Status
- Author
- Preview Image 7.4 U42+/GA42+
- Share 7.4 U42+/GA42+
- Display Date
- Creation Date
- Modified Date
- ID
Documents and Media 7.4 U23+/GA23+
- Title
- URL
- WebDAV URL 7.4 U42+/GA42+
- Filename
- Type 7.4 U44+/GA44+
- Subtype
- MIME Type 7.4 U44+/GA44+
- Version (current active version)
- Status
- Author
- Preview Image
- Download
- Share 7.4 U42+/GA42+
- Resolution 7.4 U146+/GA146+
- Aspect Ratio 7.4 U146+/GA146+
- Extension
- Size
- Creation Date
- Modified Date
- ID
- Latest Version URL

Content Performance
Liferay DXP 2024.Q4+/Portal 7.4 GA137+
The Performance tab contains various metrics for the selected asset. To view metrics for the desired asset, you must sync the asset’s sites to Analytics Cloud.

You can use the buttons on the top-right corner to limit the results with these filters:
Individual Type: All individuals (default), known individuals, and anonymous individuals.
Date Range: Last 7 days, last 28 days, last 30 days (default), and last 90 days.
The data displayed depends on the type of asset:
Web Content
-
Views: The number of times the selected web content was viewed through an asset publisher.
-
Visitors Behavior: A graph showing the number of users who viewed this web content in a given time period.
-
Top Pages Asset Appears On: A graph showing the top three pages with most visitors where this web content is used.
-
Views By Technology: A breakdown of the different kinds of devices loading this web content.
Blog Entries
-
Views: The number of times the selected blog entry was viewed through an asset publisher.
-
Comments: The number of comments on the selected blog entry.
-
Visitors Behavior: A graph showing the number of users who viewed this blog in a given time period.
-
Top Pages Asset Appears On: A graph showing the top three pages with most visitors where this blog is used.
-
Views By Technology: A breakdown of the different kinds of devices loading this blog.
Documents and Media
-
Downloads: The number of times the selected document was downloaded through an asset publisher.
-
Previews: The number of times the selected document was previewed through an asset publisher.
-
Comments: The number of comments on the selected document.
-
Visitors Behavior: A graph showing the number of users who downloaded this document in a given time period.
-
Top Pages Asset Appears On: A graph showing the top three pages with most visitors where this document is used.
-
Downloads By Technology: A breakdown of the different kinds of devices downloading this document.

Version History
Liferay DXP 7.4 U53+/Portal 7.4 GA53+
The Content Info panel displays the version history for assets from Web Content and Documents and Media. To view the version history, click Info (![]() ) for a content item and go to the Versions tab.
) for a content item and go to the Versions tab.
This tab lists up to 10 available versions for the item. If there are more versions, you can view them by clicking the View More button.
Each version displays the author of the version, the time of its creation, and a changelog. You can click the Actions button (![]() ) for a version to access these actions:
) for a version to access these actions:
Preview: Show the rendered web content or document.
Compare To: Show the difference between the selected version and another version. This opens a new page that shows additions, deletions and formatting changes between versions. This action is available only when there are two or more active versions.
Expire: Deactivate a version and activate the next available version. For instance, if there are two versions, 1.2 and 1.1, and you expire 1.2, 1.1 becomes the active version.
