Touchpoints
Touchpoints reflect the many different ways your users and customers interact with your brand. Analytics Cloud presents a broad range of analytics data that combines traditional page analytics like page views, with comprehensive site, path, and asset-specific analytics data.
Analytics Cloud’s site-wide reporting dashboard provides a comprehensive report of your entire site, showing how many unique visitors your site has over time, which pages these visitors access, what their interests are, and more. You can also drill down to analytics for individual pages to see views, visitors, and bounce rate. Path analytics show how visitors arrive at your pages, including the page they were on before yours, their location, and device type. You can also drill deeper than the page level and track the performance of many Liferay DXP Assets. With Events Analysis, you can follow your users as they interact with various predefined or custom events, such as pageViewed or blogClicked.
Navigating to Touchpoints begins with the Sites Dashboard. In Touchpoints, you can also find additional page and asset analytics.
Viewing Page Data
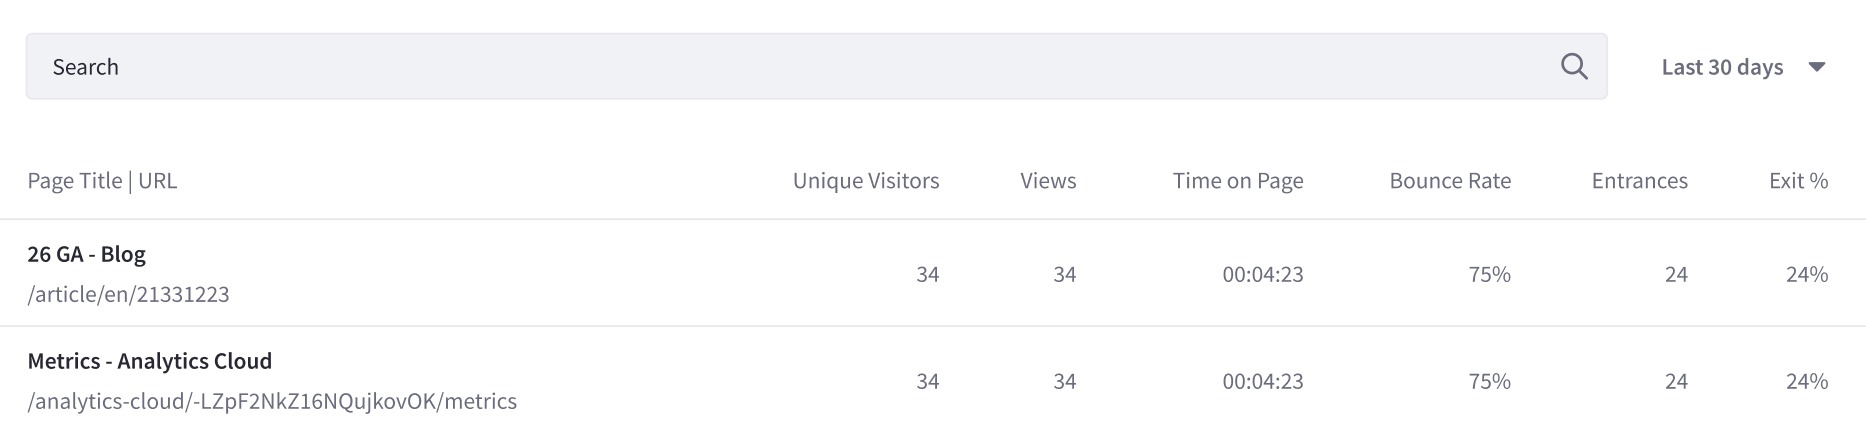
To view the list of pages with summary data,
-
From the Touchpoints section, click Sites.
-
Click the Pages tab.
Order pages in ascending or descending order based on any of the following metrics,
- Total Visitors
- Total Views
- Average Time on Page
- Average Bounce Rate
- Entrances
- Exit Rate
The metrics for ordering the page list are calculated based on the time period selected in the time period menu (at the top-right of the table). The following time periods are available:
- Last 24 hours
- Last 7 days
- Last 30 days (default)
- Last 90 days
- More Preset Periods (Yesterday, Last 28 days, Last 180 days, Last Year)
- Custom Range
Note, Liferay DXP uses the same URL for a site page regardless of the chosen language. To have Analytics Cloud track each language as a distinct site page, enable localized URLs.
To download this list of site page data as a CSV file, click Download Reports. See Downloading Reports to learn more.
Page data is based on canonical URL. Learn more about canonicalization or how to set a custom canonical URL in DXP.
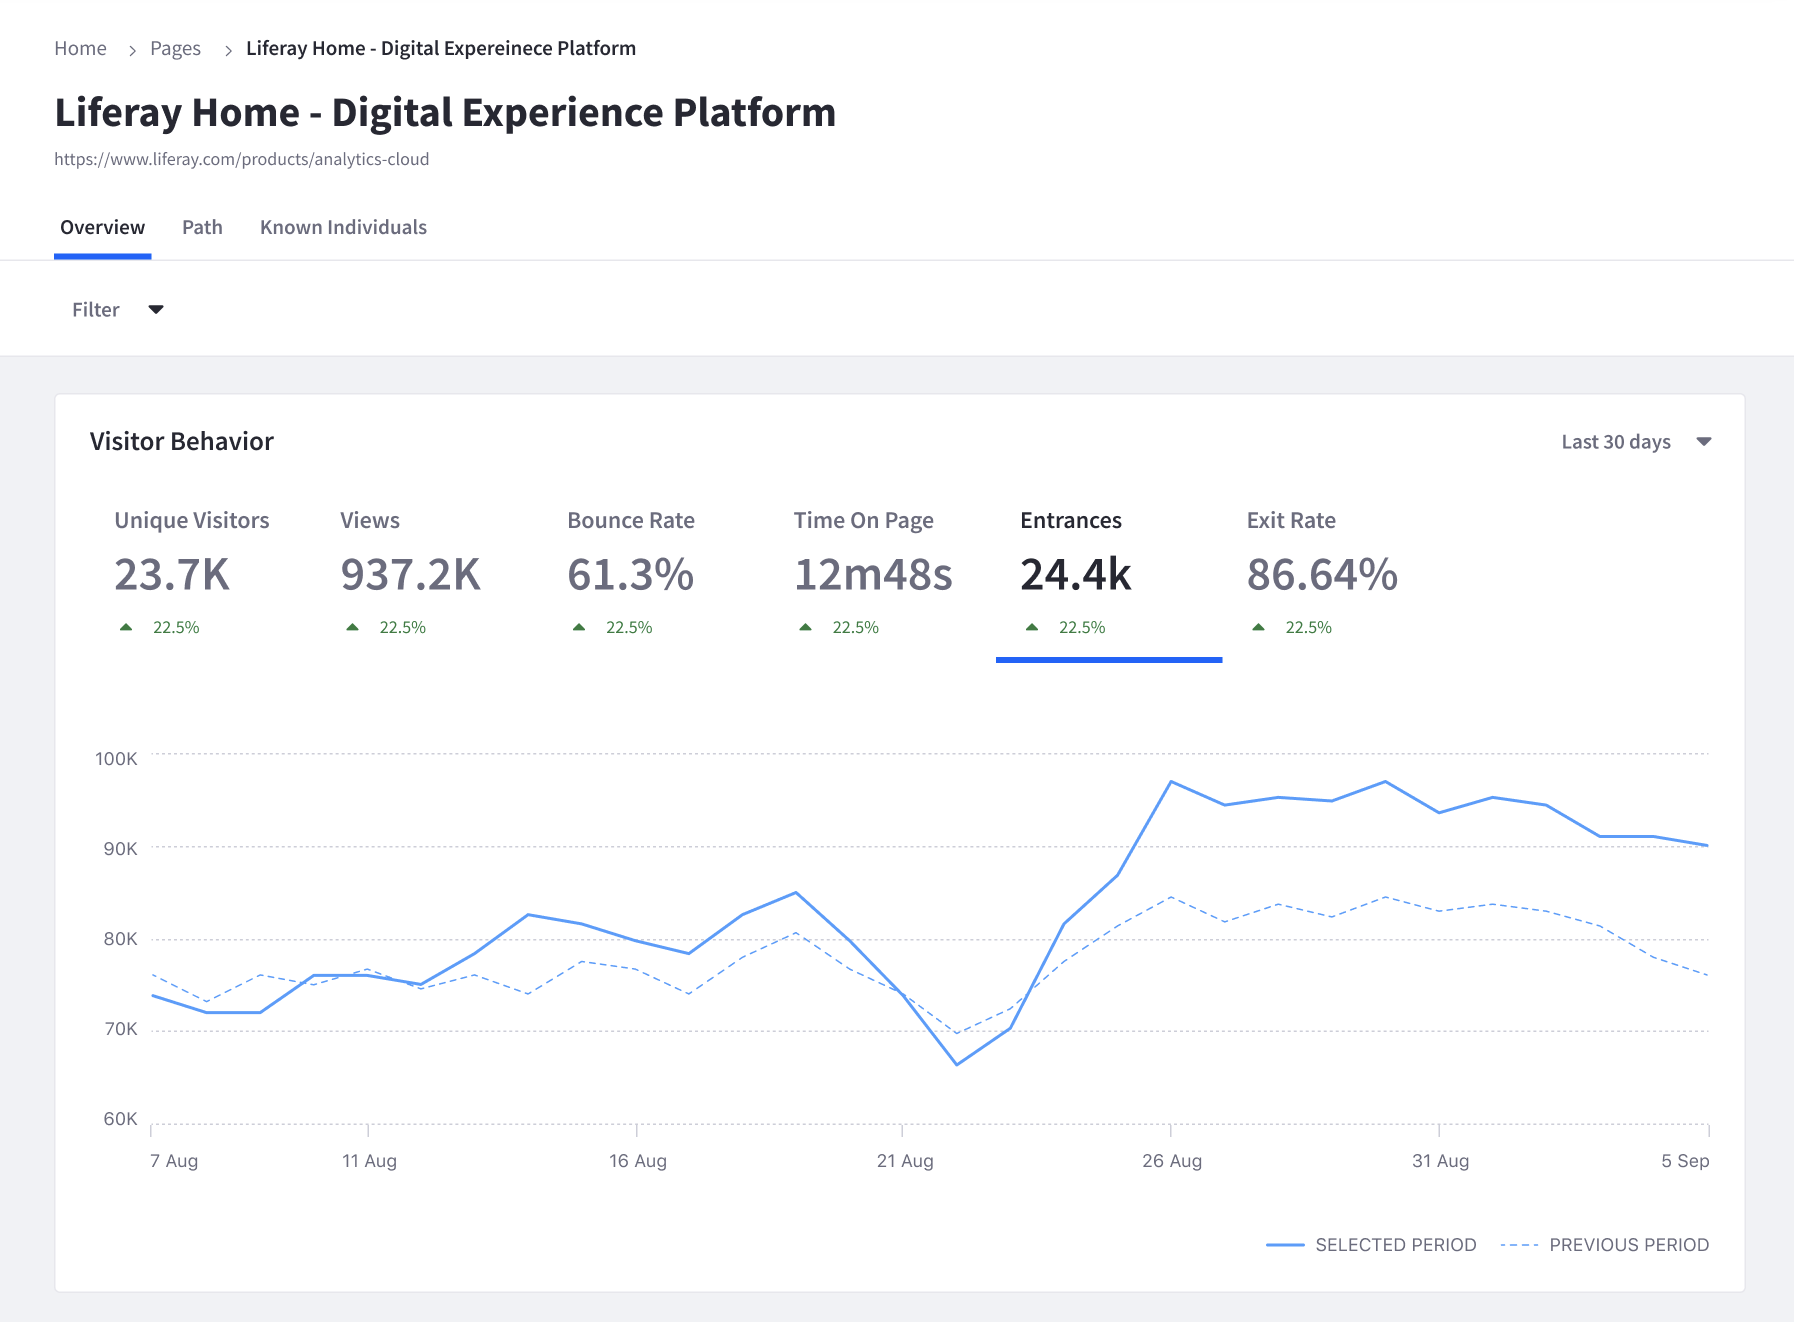
To view detailed metrics for a single page, click that page in the table. See Page Analytics for more information.
Finding Asset Data
To view analytics data on your assets,
-
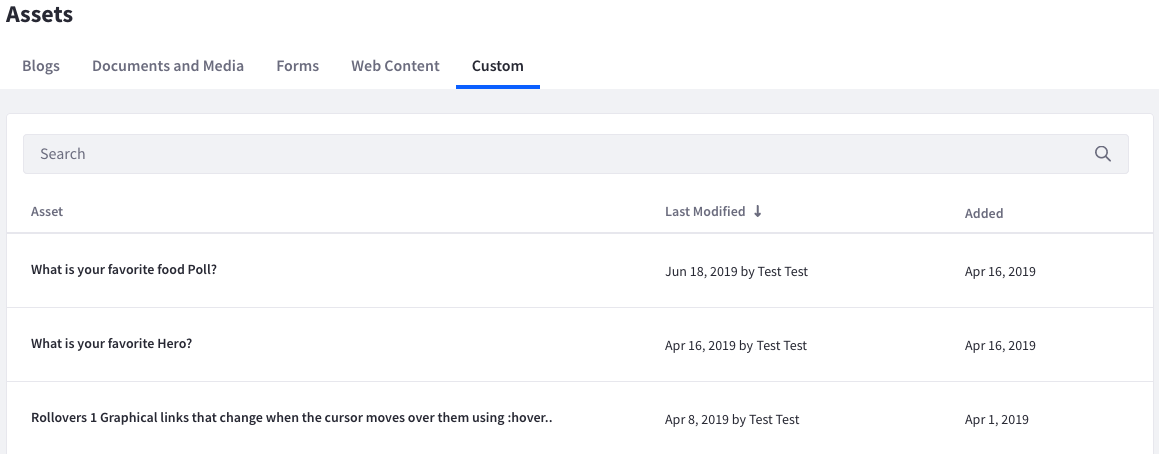
From the Touchpoints section, click Assets.
-
Choose an asset type: Blogs, Documents and Media, Forms, Web Content, or Custom.
To order assets in ascending or descending order based on any of the asset’s metrics, click the metric’s heading in the table. The metrics differ between assets. See each asset’s documentation for more information. Additionally, you can calculate the metrics over a selected time period by selecting a value from the time period menu (at the top-right of the table):
- Last 24 hours
- Yesterday
- Last 7 days
- Last 28 days
- Last 30 days (default)
- Last 90 days
Click an asset in the list to see more granular detail.
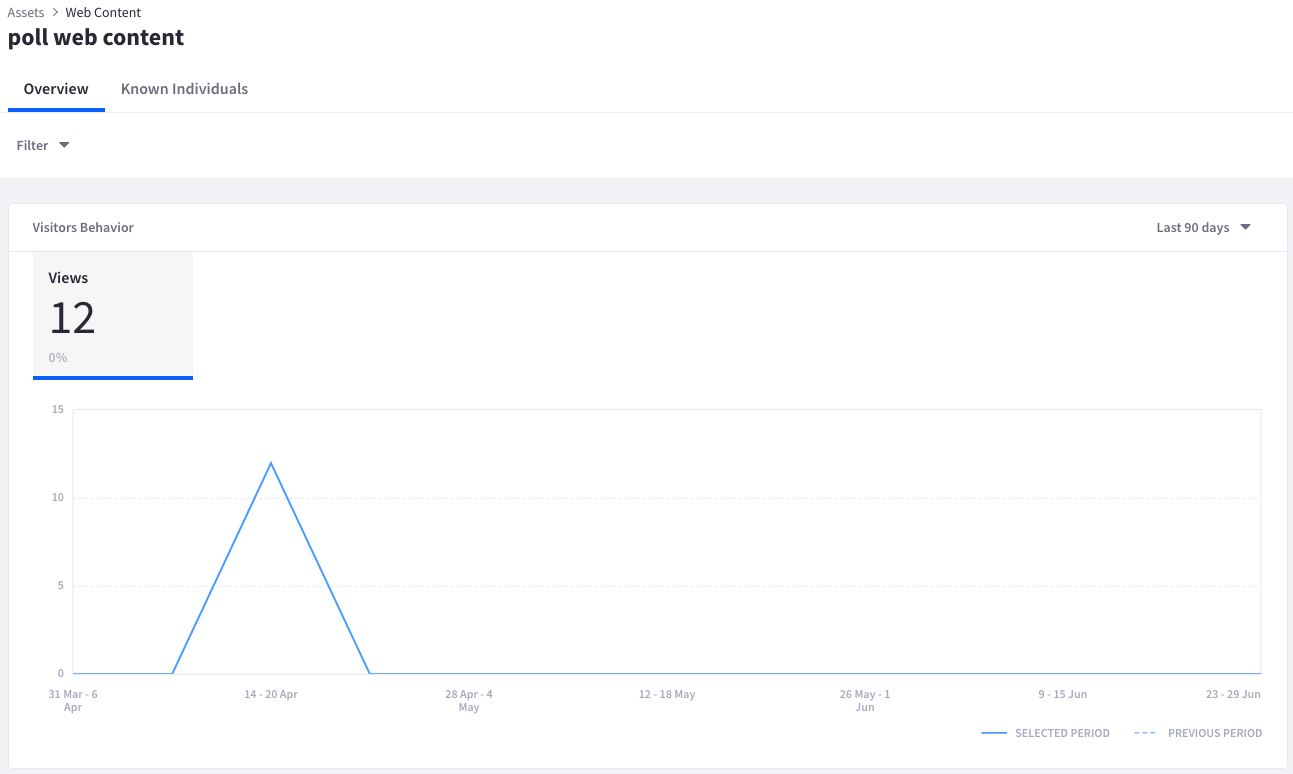
Remember that there are separate lists for different asset types. See the navigation for details on each asset.