Donut Charts
Donut charts are percentage-based. A donut chart is similar to a pie chart, but it has a hole in the center. Each data set must be defined as a new instance of the SingleValueColumn object. Follow these steps to configure your portlet to use donut charts.
Import the chart taglib along with the
DonutChartConfigandSingleValueColumnclasses into your bundle’sinit.jspfile:<%@ taglib prefix="chart" uri="http://liferay.com/tld/chart" %> <%@ page import="com.liferay.frontend.taglib.chart.model.percentage.donut.DonutChartConfig" %> <%@ page import="com.liferay.frontend.taglib.chart.model.SingleValueColumn" %>Add the following Java scriptlet to the top of your
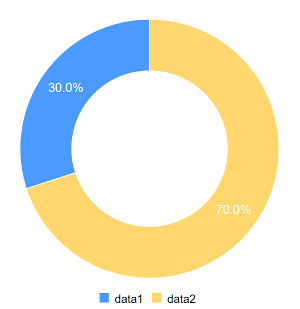
view.jsp:<% DonutChartConfig _donutChartConfig = new DonutChartConfig(); _donutChartConfig.addColumns( new SingleValueColumn("data1", 30), new SingleValueColumn("data2", 70) ); %>Add the
<chart>taglib to theview.jsp, passing the_donutChartConfigas theconfigattribute’s value:<chart:donut config="<%= _donutChartConfig %>" />
Awesome! Now you know how to create donut charts for your apps.