About the Page Audit Tool
This feature is currently behind a beta feature flag. See Beta Feature Flags for more information.
The Page Audit tool displays performance-related information about the server render time, component type, component’s origin, and cache status as well as warning messages about potential performance issues.
You need, at least, two permissions to view and use the Page Audit tool. Configure them under Site and Asset Library Administration → Site Builder → Pages:
-
Access in Site and Asset Library Administration under General Permissions
-
Update permission under Pages

Using the Page Audit Tool
The Page Audit tool (![]() ) appears on the applications bar at the top of the page.
) appears on the applications bar at the top of the page.
-
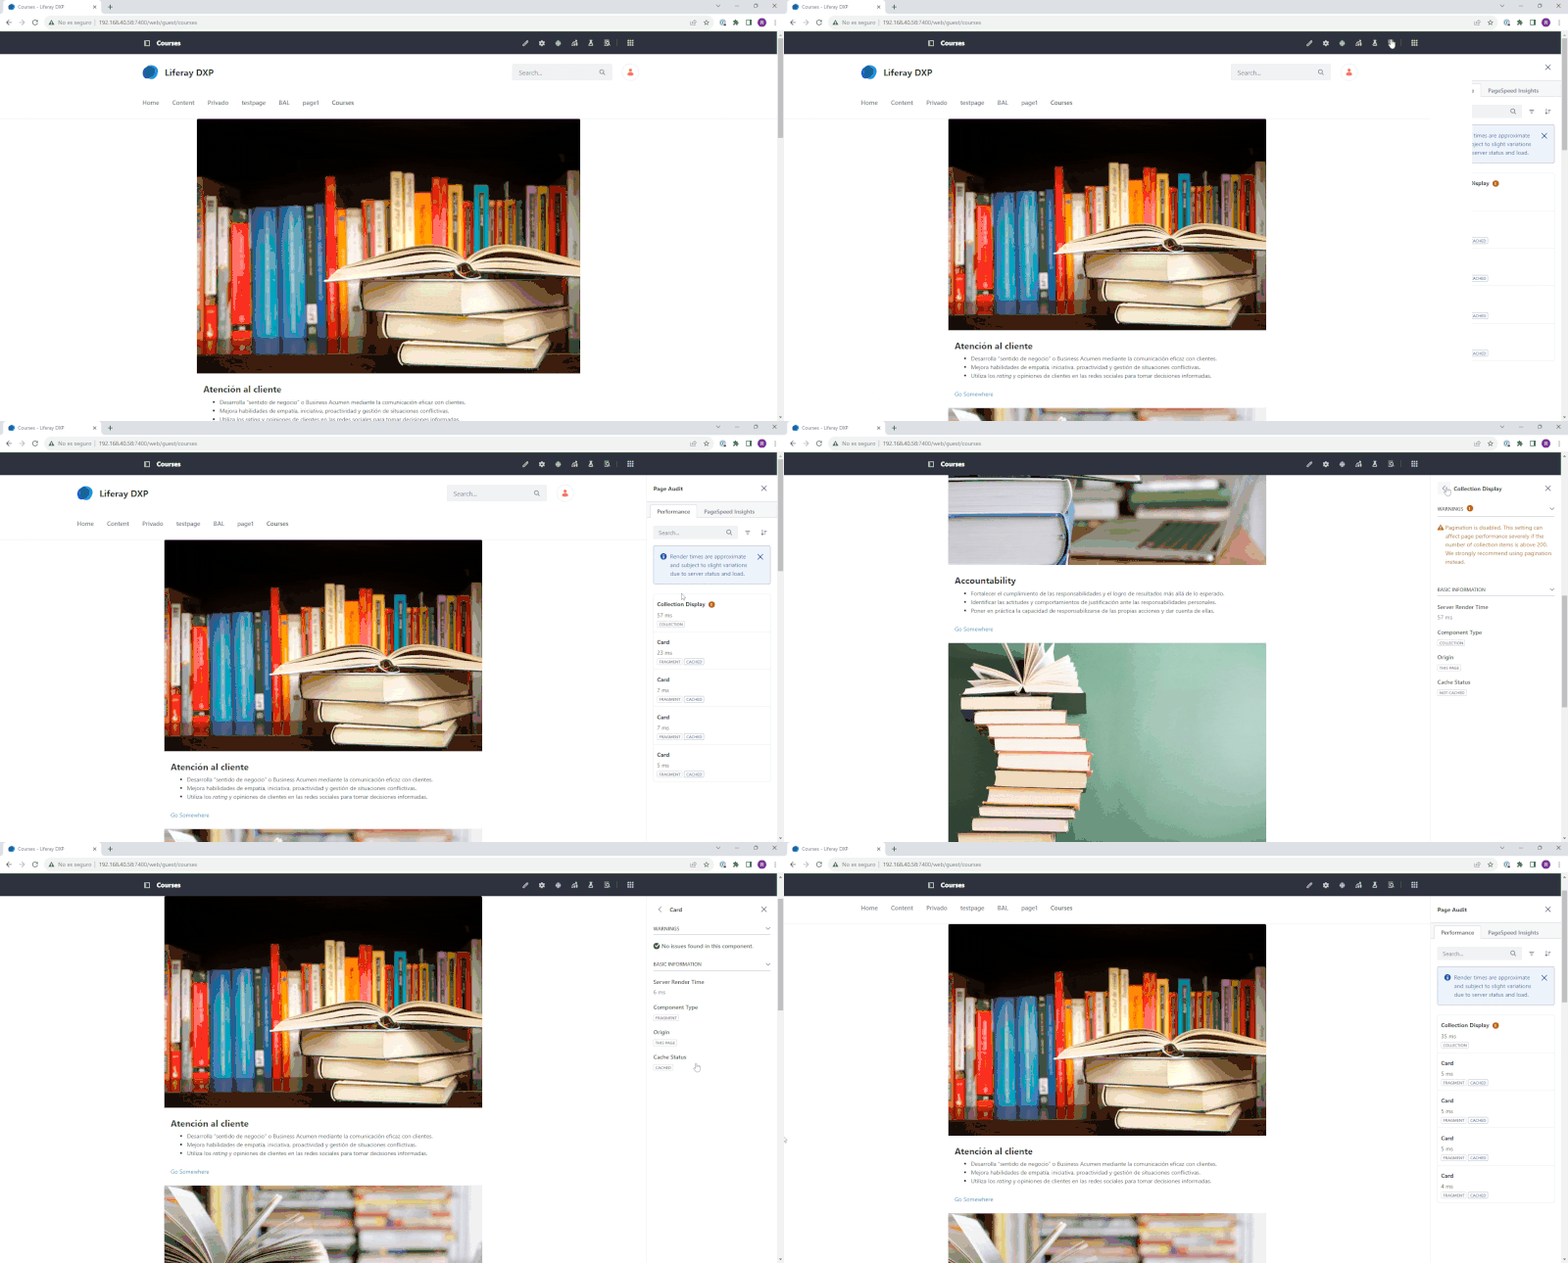
Click the Page Audit tool icon to open a sidebar where the information is displayed on the right.
Under the Performance tab appears a list of all components on the page.
Each component has an information card showing the component’s name, render time (in milliseconds), type (a label that identifies the type: fragment, collection, or widget), and cache status along with icons to interact with the component.
Under PageSpeed Insights, you can see specific recommendations for Liferay DXP if you have Google’s PageSpeed Insights service configured (an API key is required).
-
Hover over the card to highlight the component in the page.
-
Click Locate (
 ) to find and center the component on the page.
 -
With Fragments, click Open (
 ) to navigate to the fragment library.
 -
(Optional) Click on a card to display warnings and basic information about the component.
-
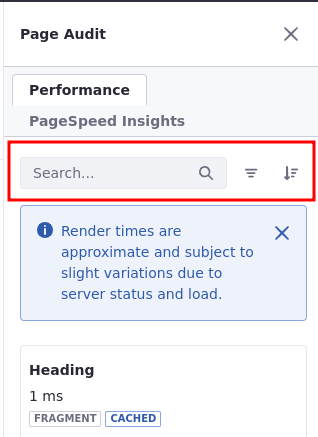
(Optional) Use the available tools (Search, Filter, and Sort) to organize or find components.
Performance Tab Tools
Under the Performance tab are tools to facilitate your navigation.
Search: Search for specific components by their names.
Filter: Filter by navigation (All or From Master - components from a Master page), cache status (Cached or Not Cached), or component type (e.g., Fragment, Widget, or Collection).
Sort: Sort components by render time. By default, items are ordered from slower to faster render time.

Warnings and Basic Information
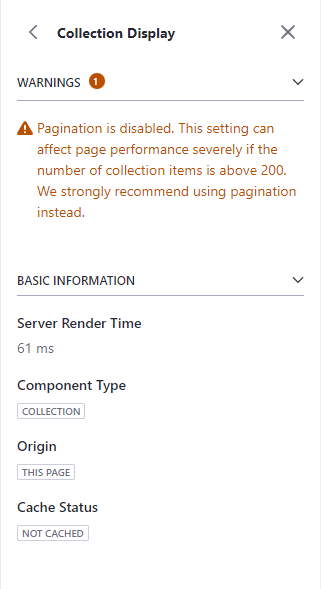
Click on a component card to display warnings and basic information about the component.

Warnings
Warnings indicate possible performance issues with page components. It also includes suggestions to solve the problem and optimize your page.
Here’s a list of warnings:
| Component | Warning | Possible Solution |
|---|---|---|
| Collection Display Fragment | Pagination is disabled. This setting can affect page performance severely if the number of collection items is above 200. We strongly recommend using pagination instead. | Enable pagination for your collection display |
| Image Fragment | Big image file size used. Please, consider configuring adaptive media, lazy loading, or reducing the image size. | Configure adaptive media, enable lazy loading, or upload a smaller image file |
Basic Information
The component card displays basic information about the component. Here’s a list of details covered:
Render time is an approximation and subject to slight variations depending on various factors (e.g., server status and load).
| Detail | Description |
|---|---|
| Server Render Time | The render time in milliseconds |
| Component Type | The component type: Fragment, Widget, or Collection |
| Origin | The origin of the component (e.g. This Page if it is originated in the same page it is displayed) |
| Cache Status | The component’s cache status: Cached or Not Cached |