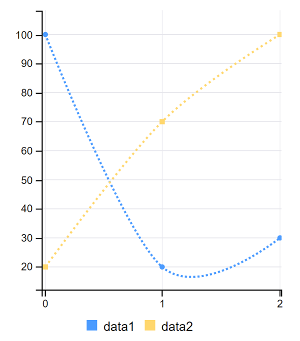
Spline Charts
Spline charts contain multiple sets of data. A spline chart connects points of data with a smooth curve. Each data series (created with the addColumns() method) is defined with a new instance of the MultiValueColumn object, which takes an ID and a set of values. Follow these steps to configure your portlet to use spline charts.
-
Import the chart taglib along with the
SplineChartConfigandMultiValueColumnclasses into your bundle’sinit.jspfile: -
Add the following Java scriptlet to the top of your
view.jsp: -
Add the
<chart>taglib to theview.jsp, passing the_splineChartConfigas theconfigattribute’s value:
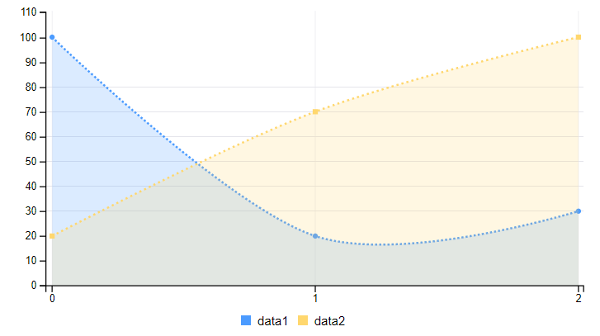
You can also use an area spline chart if you prefer. An area spline chart highlights the area under the spline curve.
Awesome! Now you know how to create spline charts for your apps.