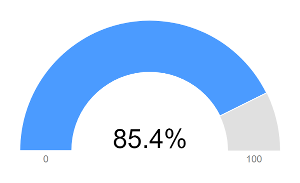
Gauge Charts
Gauge charts are percentage-based. A gauge chart shows where percentage-based data falls over a given range. Each data set must be defined as a new instance of the SingleValueColumn object. Follow these steps to configure your portlet to use gauge charts.
-
Import the chart taglib along with the
GaugeChartConfigandSingleValueColumnclasses into your bundle’sinit.jspfile: -
Add the following Java scriptlet to the top of your
view.jsp: -
Add the
<chart>taglib to theview.jsp, passing the_gaugeChartConfigas theconfigattribute’s value:
Awesome! Now you know how to create gauge charts for your apps.