Step Charts
Step charts contain multiple sets of data. A step chart steps between the points of data, resembling steps. Each data series (created with the addColumns() method) is defined with a new instance of the MultiValueColumn object, which takes an ID and a set of values. Follow these steps to configure your portlet to use step charts.
Import the chart taglib along with the
StepChartConfigandMultiValueColumnclasses into your bundle’sinit.jspfile:<%@ taglib prefix="chart" uri="http://liferay.com/tld/chart" %> <%@ page import="com.liferay.frontend.taglib.chart.model.point.step.StepChartConfig" %> <%@ page import="com.liferay.frontend.taglib.chart.model.MultiValueColumn" %>Add the following Java scriptlet to the top of your
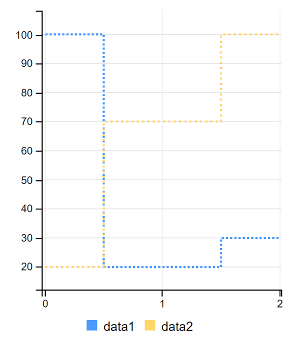
view.jsp:<% StepChartConfig _stepChartConfig = new StepChartConfig(); _stepChartConfig.addColumns( new MultiValueColumn("data1", 100, 20, 30), new MultiValueColumn("data2", 20, 70, 100)); %>Add the
<chart>taglib to theview.jsp, passing the_stepChartConfigas theconfigattribute’s value:<chart:step config="<%= _stepChartConfig %>" />
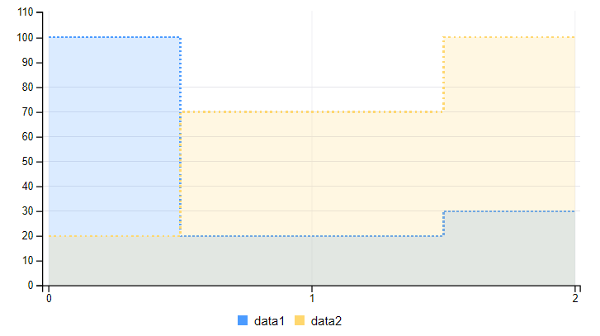
You can also use an area step chart if you prefer. An area step chart highlights the area covered by a step graph.
<chart:area-step
  config="<%= _stepChartConfig %>"
/>
Awesome! Now you know how to create step charts for your apps.