Geomap Chart
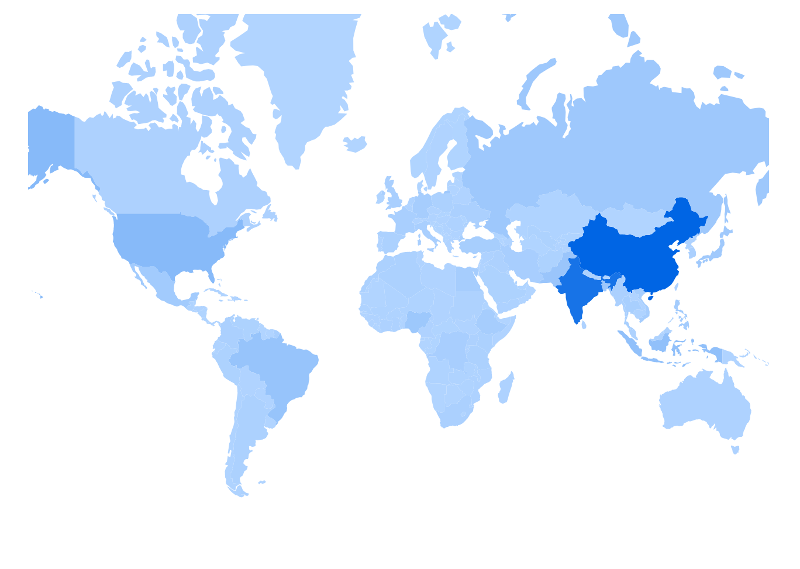
A Geomap Chart shows data based on geography, given a specified color range—a lighter color representing a lower rank and a darker a higher rank usually. The default configuration comes from the Clay charts geomap component: which ranges from light-blue (#b1d4ff) to dark-blue (#0065e4) and ranks the geography based on the location’s pop_est value (specified in the geomap’s JSON file).
Follow these steps to configure your portlet to use geomap charts.
-
Import the chart taglib along with the
GeomapConfig,GeomapColor, andGeomapColorRangeclasses into your bundle’sinit.jspfile:<%@ taglib prefix="chart" uri="http://liferay.com/tld/chart" %> <%@ page import="com.liferay.frontend.taglib.chart.model.geomap.GeomapConfig" %> <%@ page import="com.liferay.frontend.taglib.chart.model.geomap.GeomapColor" %> <%@ page import="com.liferay.frontend.taglib.chart.model.geomap.GeomapColorRange" %> -
Add the following Java scriptlet to the top of your
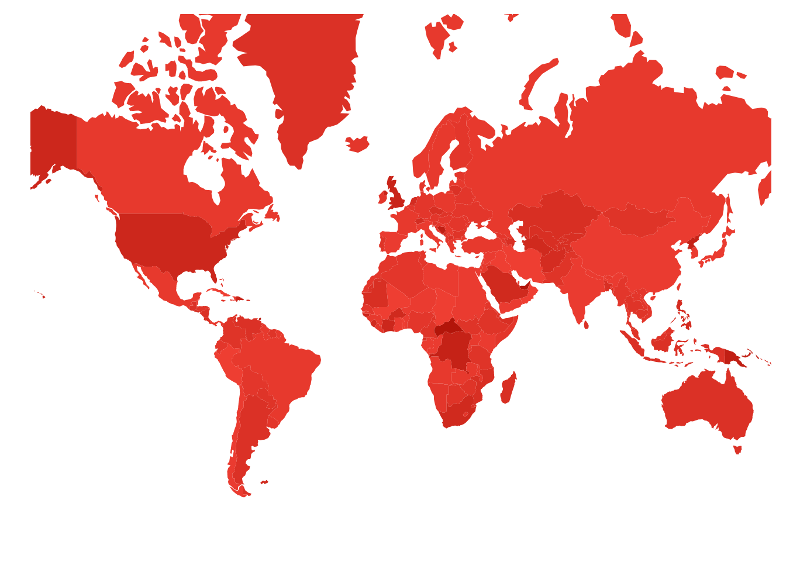
view.jsp. The colors—a color for minimum and a color for maximum—are completely configurable, as shown in the second example configuration below:_geomapConfig2. Create a newGeomapColorRangeand set the minimum and maximum color values with thesetMax()andsetMin()methods. Specify the highlight color—the color displayed when you mouse over an area—with thesetSelected()method. use thegeomapColor.setValue()method to specify the JSON property to determine the geomap’s ranking. Specify the JSON filepath with thesetDataHREF()method. The example below displays a geomap based on the length of each location’s name:<% GeomapConfig _geomapConfig1 = new GeomapConfig(); GeomapConfig _geomapConfig2 = new GeomapConfig(); GeomapColor geomapColor = new GeomapColor(); GeomapColorRange geomapColorRange = new GeomapColorRange(); geomapColorRange.setMax("#b2150a"); geomapColorRange.setMin("#ee3e32"); geomapColor.setGeomapColorRange(geomapColorRange); geomapColor.setSelected("#a9615c"); geomapColor.setValue("name_len"); _geomapConfig2.setColor(geomapColor); StringBuilder sb = new StringBuilder(); sb.append(_portletRequest.getScheme()); sb.append(StringPool.COLON); sb.append(StringPool.SLASH); sb.append(StringPool.SLASH); sb.append(_portletRequest.getServerName()); sb.append(StringPool.COLON); sb.append(_portletRequest.getServerPort()); sb.append(_portletRequest.getContextPath()); sb.append(StringPool.SLASH); sb.append("geomap.geo.json"); _geomapConfig1.setDataHREF(sb.toString()); _geomapConfig2.setDataHREF(sb.toString()); %> -
Add the
<chart>taglib to theview.jspalong with any styling information for the geomap, such as the size and margins as shown below:<style type="text/css"> .geomap { margin: 10px 0 10px 0; } .geomap svg { width: 100%; height: 500px !important; } </style> <chart:geomap config="<%= _geomapConfig1 %>" id="geomap-default-colors" /> <chart:geomap config="<%= _geomapConfig2 %>" id="geomap-custom-colors" />
Awesome! Now you know how to create geomap charts for your apps.