Chart Tag Library
Lines, splines, bars, pies and more, the Chart tag Library provides everything you need to model data. Each taglib gives you access to the corresponding Clay component. These components contain the default configuration for the UI.
To use the Chart taglib in your apps, add the following declaration to your JSP:
<%@ taglib prefix="chart" uri="http://liferay.com/tld/chart" %>
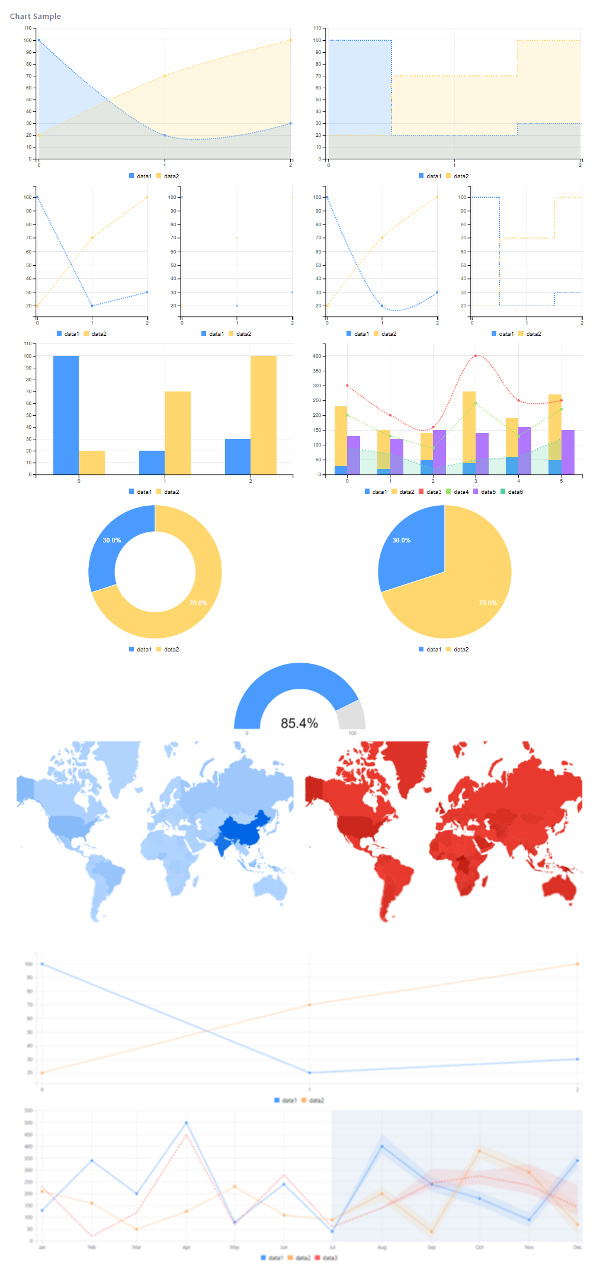
This section covers the types of charts you can create with the Chart taglibs. Each article contains a set of chart examples along with sample Java data and a figure displaying the rendered results.